The ephemeral composable stack - Grafana: dashing aboard for a clearer view

Grafana Labs specialises in what it calls ‘open and composable’ operational dashboards.
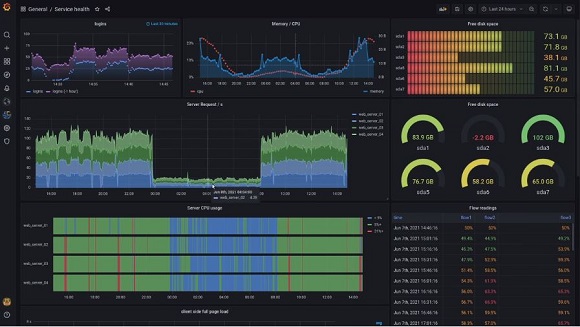
That’s dashboards for viewing virtualized compute stack metrics, logs and traces – not dashboards in any other sense, obviously.
This year the company has rolled out new product updates including the availability of Grafana 8.0 and Grafana Tempo 1.0.
The latest product updates are intended to deliver enhanced visualisations, such as streaming panels, a brand new unified alerting system and the addition of Grafana Tempo distributed tracing to Grafana Cloud.
The company suggests that many enterprises have struggled with implementing distributed tracing and correlating it with the other pillars of observability i.e. metrics and logs.
The introduction of Grafana Tempo 1.0 aims to simplify this process without the need for third-party tools and infrastructure.
Torkel Ödegaard, creator of the Grafana project and co-founder at Grafana Labs claims that more than three-quarters of a million organisations are actively using the Grafana platform to monitor and visualise everything from their personal smart home devices to crucial business application data.
“Grafana 8.0 focuses on new ways for users to build powerful visualizations, easily monitor and alert on their systems to rapidly respond to changes, and reduce the infrastructure necessary to run their Grafana deployments,” said Ödegaard,
Maximum traces, minimal overhead
Grafana Tempo is a high-scale distributed tracing backend built to help users manage their traces with minimal infrastructure investment, only requiring object storage to operate.
“Unlike existing tracing backends, Grafana Tempo is able to rapidly scale and reduces the need to sample traces, allowing you to guarantee every request is backed by a trace. Grafana Tempo can be used with any open source tracing protocol such as Jaeger, Zipkin and OpenTelemetry,” said Ödegaard.
In addition to Tempo 1.0, Grafana Labs also announced the general availability of Grafana Cloud Traces, which integrates traces with metrics, logs, and dashboards in the company’s managed Grafana Cloud observability stack. Users can analyse up to 50GB of traces at no cost in the free tier of Grafana Cloud.
According to Ödegaard, with Grafana Tempo users are able to dive deeper into their observability data and pinpoint specific traces in order to answer questions like:
“Why was this customer’s query slow?” “An intermittent bug showed up again. Can I see the exact trace?”
By discovering traces through logs and exemplars and storing the traces by ID in Tempo, organisations gain more visibility into their applications while simultaneously reducing their infrastructure spend.
“Leading the list of features introduced in Grafana 8.0 is the brand new unified alerting system, which unifies Prometheus alerting and Grafana alerting, allowing you to view and edit Grafana alerts and view Prometheus alerts in the same user interface,” said Ödegaard and team.
This provides a common experience around alerting for all Grafana users and data sources.
Grafana is an open source technology for dashboards and visualisation — Grafana Labs helps companies manage their observability strategies with full-stack offerings that can be run fully managed with Grafana Cloud, or self-managed with Grafana Enterprise Stack.