Grafana 7.0 offers observability via metrics, logs, traces & the ‘new beyond’

Grafana comes from Grafana Labs — it is a composable open source platform for metrics analytics, monitoring and visualisation.
It’s all about achieving observability, now that ‘observability’ is such a defined entity (or target, or goal or just ‘thing’) in today’s most contemporary IT stacks.
Grafana has been increasing in adoption recently as more developers use Kubernetes – they want insight into their applications, so they have turned to open source projects like Prometheus. Loki and Grafana.
These tools take information out of databases and can turn them into logs, metrics and visualisations.
For developers, Grafana helps in the following ways:
- It makes it easier to get all datasets from applications together into one place
- It can transition between log data and metric data and it is adding tracing too to get observability into what is taking place around any transactions
- It provides one place where all analytics, metrics and application performance monitoring data can be gathered.
If developers are using Splunk / New Relic / AppDynamics or other sources of data, they can bring them in alongside your open source tools and databases.
Grafana Labs’ commercial products include Grafana Enterprise, with key features and support for large organisations, and Grafana Cloud, a hosted and managed Prometheus and Graphite (for metrics) and Loki (for logs) offering.
Grafana 7.0
As we now hit iteration 7.0, Grafana Labs says it has enhanced Grafana to simplify the development of custom plugins and increase its visualisation torque.
There are over half a million active installations (at the time of writing) and millions of dashboards in use. Additionally, there are hundreds of company, commercial and community data-source plugins and thousands of sample/starter dashboards supporting users’ needs both on-premise and in the cloud.
Grafana 7.0 is an accumulation of effort commencing after 6.0 spanning nearing 18,000 commits and 3,699 pull requests from 362 contributors around the world.
Creator of Grafana and co-founder and CGO of Grafana Labs Torkel Ödegaard says that this is a major release that represents a system-wide advancement i.e. not just a .0 or laundry list of features.
Ödegaard highlights some of the new power by saying that, for example, by chaining a simple set of point-and-click transformations, users will be able join, filter, re-name and calculate to get the results they need.
“We believe vendors shouldn’t own observability strategies; users and organisations do. We are focused on helping them in their journey through an open and composable framework for uniting a complex environments that can range from a company’s own custom APIs and open source metrics like Prometheus or Graphite and Loki for logs, to merging open source and proprietary systems like Elasticsearch, Datadog, Splunk, Oracle and ServiceNow,” said Raj Dutt, co-founder and CEO of Grafana Labs.
Grafana 7.0 is available immediately for Grafana Cloud customers or through a free 30-day cloud trial and for download.
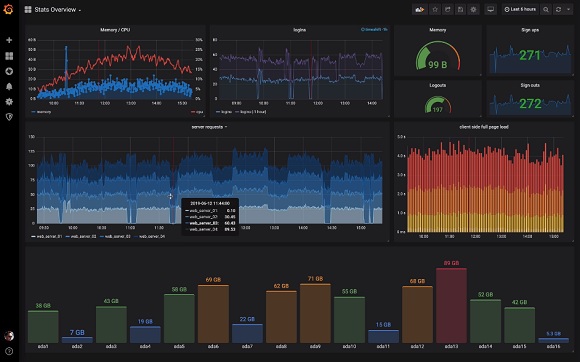
The Grafana dashboard