What to expect from Grafana ObservabilityCON

The Computer Weekly Developer Network team has been following the growth of observability for more than a decade now.
Although some may define observability as a sub-sector function that sits under the wider Ops-operations umbrella, most of us would now classify it as a core practice, discipline and set of platform methodologies in and of itself.
Today we can reasonably suggest that observability has become a central part of modern software engineering, moving beyond infrastructure monitoring to also encompass analytics that is focused on measuring, quantifying and grading degrees of application performance, distributed systems and cloud-native environment connectivity, and, increasingly, AI workloads.
ObservabilityCON
Certainly one to explain observability as a stand-alone (but inherently connected) function in its own right is Grafana Labs. The company’s annual ObservabilityCON (October 19-21, San Francisco, CA) is a hands-on technology showcase for developers, site reliability engineers (SREs), platform teams and other IT Ops pros.
This year’s event places a strong emphasis on… (wait for it, wait for it… you’ll never guess) the intersection of AI and observability.
Giving Grafana some credit, the theme “AI for Observability. Observability for AI” isn’t bad; at least that provides a kind of two-way, tangentially balanced way of dealing with the subject.
Will there be announcements covering AI-powered tooling within Grafana Cloud along with developer and Ops guidance on monitoring and managing AI applications? Don’t ask silly questions – of course that’s what Grafana is going to talk about.
“AI is quickly becoming a core part of how teams build and run their systems, and observability has to keep pace,” said Grafana senior director of AI, Mat Ryer. “At ObservabilityCON, we’ll focus on making sure engineers have the same clarity into their AI workloads, agents, models, prompts, costs that they’ve always had into their infrastructure. That’s what ‘AI for Observability, Observability for AI’ means in practice.”
Ryer suggests that agents have “already revolutionised” how software gets written – so now it’s time to do the same for how it runs.
“The next frontier isn’t just AI writing code, it’s AI operating systems: watching, diagnosing, and acting on the same telemetry engineers rely on today. That shift is happening faster than most teams expect, and we’ve been heads-down building for it. We’re excited to deliver this new era of agentic operations at ObservabilityCON this year and show engineers what it actually looks like in practice, not just talk about where the industry is headed, but put it in their hands,” added Ryer.
Demos and deep dives
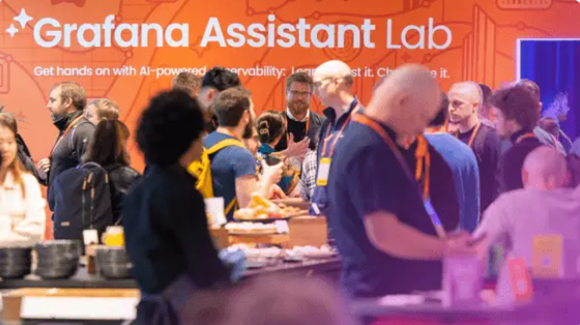
The conference will feature live demos, technical deep dives, use case studies (from customers, obviously) and hands-on workshops.
According to Grafana, “ObservabilityCON has established itself as a technical conference rather than being an event that just rolls out product releases. The agenda combines keynote presentations with engineering sessions that explore topics including OpenTelemetry, tracing, telemetry pipelines, digital experience monitoring and site reliability engineering.”
Workshops will cover how to build dashboards, troubleshoot telemetry data and learn best practices from Grafana engineers. The “Ask the Experts” sessions and an expo area will be designed to help the organisation talk about how engineering teams increasingly need visibility into model behaviour, latency, token consumption and overall application reliability.
Grafana Assistant
Grafana Labs is therefore saying that observability is an essential layer for understanding not only infrastructure health, but also how AI-powered applications behave in real-world environments.
Attendees can anticipate a major focus on the evolution of automated assistance, which will include the capabilities of Grafana Assistant – a technology that now moves beyond basic natural language query generation into deeper incident management, automatic anomaly discovery, and guided root-cause analysis (RCA). Here we’ll also note Grafana Cloud AI Observability (observability for AI), which was announced in April.
In a survey Grafana carried out earlier this year, the following key stats are highlighted:
- Roughly 9 in 10 respondents see value in using AI for forecasting/trend-spotting, root cause analysis, onboarding, and generating dashboards, alerts, and queries.
- The ability for AI to take autonomous action is seen as valuable by 77%, but it has the highest degree of scepticism by a wide margin, which is why being able to see and understand how your AI works in production is important for building trust.
An open ecosystem
 The event is also expected to illustrate Grafana’s open ecosystem i.e. the company has supported many open standards over the years, including OpenTelemetry alongside projects such as Prometheus, Loki, Tempo and Mimir.
According to Grafana, “As software estates become increasingly distributed and AI becomes embedded into production systems, observability is evolving from an operational concern into a core engineering discipline. Rather than simply collecting metrics, logs and traces, organisations are looking for ways to turn telemetry into actionable insights that support faster software delivery and more resilient digital services.”
OpenTelemetry standardisations
We also expect Grafana to talk about the expansion of OpenTelemetry standardisations and native cloud integrations.
“As systems shift toward unified monitoring frameworks, expect deep dives into OpenTelemetry and continuous profiling. Rather than treating metrics, logs, and traces as separate, siloed data streams, the event showcases workflows designed to harmonise these layers into a single, cohesive plane,” states the company in its show promo materials.
The event will also likely feature discussion around data cost management. With cloud spending on the rise, the popular term here is “adaptive telemetry” i.e. using intelligence to automatically drop (or lower the priority on) redundant or low-value data, while retaining high-fidelity analytics when production environments experience a fault.
Grafana ObservabilityCON for developers
For software developers, the company appears to be saying that we’ve “shifted beyond the traditional friction of system instrumentation” to now focus on the expansion of AI incident tools, which will (we hope) mean developers and their engineering counterparts will spend less time manually writing complex PromQL, LogQL, or TraceQL queries, and more time fixing root issues.
“With updates focusing on ‘observability as code’ and eBPF instrumentation, teams can embed monitoring directly into their deployment pipelines without writing boilerplate configuration code. Essentially, the role of the developer is shifting from actively hunting for bugs across disconnected dashboards to reviewing contextual, AI-synthesised hypotheses that pinpoint exactly where a code deployment went wrong,” stated Grafana, in its show previews.
So remember then, observability isn’t just basic infrastructure alerts anymore (although it is that too)… it’s monitoring tools for developer workflows with AI-accelerators in environments that are optimised for both performance and cloud-cost efficiency.