Dynatrace eyes AI-powered AWS & Azure observability

Software intelligence Application Performance Management (APM) specialist Dynatrace didn’t let the summer slowdown stop its news train.
The firm has been working on back-room engineering to now extend its platform to support all services from Amazon Web Services (AWS) that publish metrics to Amazon CloudWatch.
Amazon CloudWatch is what it sounds like it is i.e. a technology that provides monitoring and observability of AWS resources and applications on AWS and on-premises environments.
The company claims that this is a good combo play i.e. by combining Amazon CloudWatch metrics with the data already captured by the Dynatrace platform, data engineers can get deeper, dynamic and downright distinguished insight into the inner workings of cloud.
In practical terms, Dynatrace will automatically identify and collect metrics from the 95 AWS services currently supported by Amazon CloudWatch.
Metrics from these and all other services that publish metrics to CloudWatch are automatically combined with the distributed tracing, log, user experience and other observability data already processed by the Dynatrace platform.
Self-adjusting baselining
The end result (if you’re both a Dynatrace and AWS customer) is that you get all CloudWatch metrics streamed to dashboards automatically. Plus… you also gain automatic, self-adjusting baselining, immediate anomaly detection and precise root-cause determination (prioritised by business impact, which is nice) across an entire AWS and hybrid/multi-cloud environment.
Dynatrace claims that this combination of CloudWatch metrics, additional observability data, automation and AI-powered assistance saves data-developer teams time and resources.
“We’ve always delivered distributed tracing and code-level insights for applications and microservices running on AWS. This enhanced AWS integration allows us to provide rapid support as Amazon introduces new services for observability into any layer or service in their cloud stack,” said said Steve Tack, SVP product management, Dynatrace.
As in AWS, it is in Azure
From AWS onwards then and Dynatrace also used the summer to announced the extension of its Software Intelligence Platform to automatically ingest metrics from all services supported by Microsoft Azure Monitor.
Similarly then, Microsoft Azure Monitor is Microsoft’s product for collecting telemetry data from Azure environments.
Combining these metrics with the data already captured by the Dynatrace platform provides insights into their Azure and multi-cloud environments.
Did someone just say “faster cloud adoption and more effective digital transformation” there? Yeah, of course they did, that what it always says on the packet doesn’t it?
With this extension, Dynatrace will ingest metrics from over 80 Azure Monitor services that span application and microservices workloads, as well as infrastructure-related services.
This means metrics from services such as Azure HDInsight for Apache Hadoop, Spark and Kafka, Azure Container Instances for container deployment and Azure Kubernetes Service are now automatically combined with the distributed tracing, log, user experience (and other observability data) already processed by the Dynatrace platform.
With this data set from Azure, Dynatrace’s Smartcape (which continuously maps an organisation’s full-stack topology) and the Dynatrace AI engine, Davis, can instantly identify and prioritise a broader set of issues and anomalies in Azure environments.
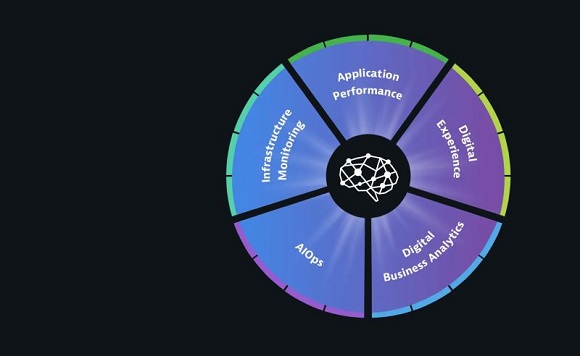
Image source: Dynatrace