
Tupungato - stock.adobe.com
Hit the north! UK datacentre focus shifts to M62 and points north
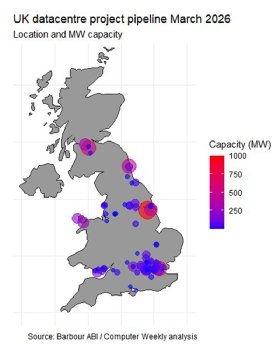
Barbour ABI data shows 8GW of total datacentre pipeline with most big projects in the north and Scotland, while London and the M4 corridor are about 25% of projected capacity

The UK’s largest datacentre construction projects are shifting north, as market saturation and power grid connection issues hit the south east of England.
Of the UK’s top 10 datacentre projects, only one – at East Havering in Essex, with projected capacity of more than 600MW – is in the London area.
The remainder, totalling just under 4GW, are spread north from Oxfordshire, to Lincolnshire, North Wales, the north-east and Scotland, most being sites that can tap into offshore wind or nuclear power.
That data comes from construction project information provider Barbour ABI, which tracks planning applications and construction projects.
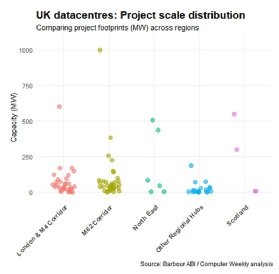
We took that data to calculate the regional distribution of datacentre projects and trends in terms of year of project completion and megawatt capacity.
The big picture is that there are 119 datacentres totalling an estimated 8GW currently in the planning process or under construction in the UK right now.
The M62 corridor – with 44 projects totalling 3.3MW – is the most active region, with London and the M4 corridor just behind with 40 projects and 2.3MW.
Steve Shelley, chief analyst for Barbour ABI, said: “The shift towards the north, and particularly the M62 corridor, has several explanations. Given that London and the south-east has already seen a boom in datacentres in previous years, there are capacity issues in terms of power and land space now coming into play for London. The relative cheapness of land in the north when compared to London is also sure to be a factor.
“The proximity to Leeds and particularly Manchester at either end of the M62 will certainly be an enticing factor for datacentre developers to supply these major hubs,” he added.
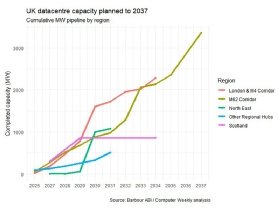
For the M62 region, the data reflects a larger number of smaller projects in the short term, but also some very large projects that will take up to a decade to achieve full capacity. In projected capacity of completed projects, London and the M4 corridor and the M62 corridor largely mirror each other until 2029.
After that, a number of key planned datacentre completions see the capital and M4 region open a gap. That’s mostly to do with projected 2030 completion dates for projects that include: 600MW (according to planning application) at East Havering; 170MW (estimated) at Uxbridge alongside new power grid capacity; 125MW (estimated) in planned Google datacentres at Thurrock; and 320MW (reported in media) at South Mimms.
Having said that, projects such as the 1GW Elsham Wolds datacentre in North Lincolnshire are multi-phase, and so will see datacentre capacity delivered in stages up to its 2037 completion date.
The 119 datacentre projects have an average projected construction period of three years for single-phase developments, with the highest number of completions set to arrive in 2030, when 17 projects and just over 2GW will come on stream.
Top 10 UK datacentres
The biggest project in capacity terms is the 10-year (multi-phase, 2037 final completion) Elsham Tech Park project in North Lincolnshire, with a projected 1GW capacity and a contract value of £7.5bn. The biggest in value terms is the project at the former Blyth power station in Northumberland, which comes in at £10bn and an estimated 500MW.
Barbour ABI pulls planning application data from UK local authorities and collates it for construction industry customers. We can use it to see the datacentre pipeline. While the data is extremely useful, planning application information provides challenges for those who want to track datacentre projects.
Regional summary
There is no requirement in planning applications to explicitly label a project as a datacentre, and whether such an application includes datacentre capacity in megawatts is not uniform.
For example, only 28 out of 119 projects listed contained a reference to MW capacity. Meanwhile, most of them (90) listed a floor area for the proposed building.
So, for the 22 that had both values, it was possible to calculate and establish a level of confidence in the relationship between floor area and megawatts, and to predict megawatts from floor area for those where only that was known.
Such megawatt figures are likely to be an underestimate, however, especially as over time, the megawatt draw of graphics processing units (GPUs) increases for the same physical footprint.
Finally, if we filter out projects smaller than 7.5MW – the government defines larger than 10MW as an enterprise datacentre – we remove 41 very small installations, but the relative weight of M62 (33 datacentres, 3.3MW total) vs London and the M4 (27 datacentres, 2.2MW total) doesn’t change much.
Read more about datacentre development
- Huge grid and heat challenges ahead as Nvidia set for 1MW rack: With Nvidia Feynman in 2028, 1MW datacentre racks will produce as much heat as 200 5kW ovens. Industry and government must respond, says Schneider Electric UK datacentre executive.
- Datacentre energy demands set to soar by 2030 as AI growth accelerates, predicts Gartner: IT market watcher Gartner has shared its projections about how the energy consumption habits of datacentres are set to change as AI takes off.