Splunk widens observability aperture
Splunk had a busy autumn/fall conference season, the Computer Weekly Developer Network logged in ‘virtually’ to the annual .conf conference and exhibition to hear news of the company’s latest augmentations.
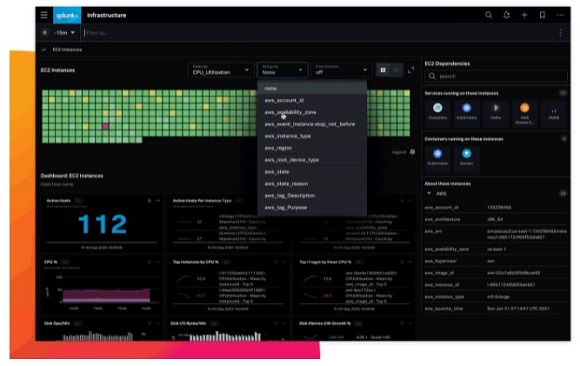
New this year are enhancements to the Splunk observability portfolio including advanced product innovations for Splunk Application Performance Monitoring (APM), Splunk Real User Monitoring (RUM), Splunk Synthetic Monitoring, Splunk Log Observer, Splunk Infrastructure Monitoring and Splunk IT Service Intelligence.
With these expanded observability capabilities, Splunk says customers gain increased visibility across all environments.
The company says its engineering has focused on changing application (and, ultimately, user) requirements as a result of the continued adoption of cloud-native technologies and the increasingly complex infrastructure and applications that accompany them.
The Splunk observability portfolio aims to offer what the company calls full-stack service-centric AI-powered observability.
Metrics, traces & logs
In Splunk terms, that means the company is talking about control of data — metrics, traces & logs — from the front-end device to the back-end application service.
Plus, it’s all in real-time and at scale… but we have heard that message before.
“Observability at its core is a data opportunity and to use that data effectively organisations need a solution that can help ingest and analyse high-velocity data across increasingly dynamic environments and architectures,” said Spiros Xanthos, VP of product management, observability and IT operations, Splunk.
To enhance the reliability and performance of customers’ existing monolithic applications, Splunk unveiled the new AlwaysOn Profiling for Splunk APM, currently in preview.
This technology extends existing full-fidelity tracing to provide customers with continuous code-level visibility and analysis so they can find and fix service bottlenecks, along with identifying resource optimisation and cloud cost savings opportunities.
Did they (it, the company) really say ‘cloud cost saving’ there? Well, even if there isn’t a whole lot of that actually happening in the real world, the push to provide technologies that might support some form of cost rationalisation (arguably) can’t be a bad thing.
Wham, bam, Splunk APM
Splunk is also previewing enhanced Database Visibility for Splunk APM, which automatically uncovers slow queries that are causing transaction latency, without having to instrument their databases.
The company says that with these innovations, Splunk APM customers can now monitor and troubleshoot application performance issues up to 80% faster, accelerating code deployments and reducing service interruptions before they impact the end user.
There was more besides here in the observability sphere i.e. this was Splunk’s main product update for the .conf21 event itself, but hopefully, this provides a taste of the wider direction and software engineering effort within.


