The human face of Big Data
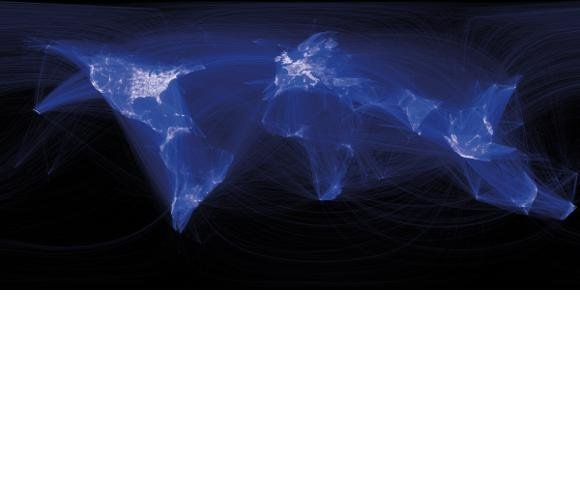


Paul Butler believes that visualising data is like photography. Instead of starting with a blank canvas, he manipulates the lens used to present the data from a certain angle. When the data is the social graph of millions of Facebook users, there are many lenses through which you can view it. One that piqued his curiosity was the locality of friendship. He set out to create a visualisation showing which cities had a lot of friendships between them. After a few minutes of rendering, the image that appeared on his screen was a surprisingly detailed map of the world—with lines that represented not coasts or rivers or political borders, but real human relationships … a friendship made while traveling, a family member abroad, an old college friend pulled away by various forces of life. The result is not just a pretty picture—it’s a reaffirmation of the impact and relationships people have as they connect across oceans and borders.
Read more from Rick Smolan and Jennifer Erwitt's book: Human Face of Big Data
Pulse of the planet by Esther Dyson
Data Driven by Jonathan Harris