Andrey Popov - stock.adobe.com
How the British Red Cross harnessed digital mapping honed abroad for the domestic Covid-19 crisis
The British Red Cross and the Voluntary and Community Sector Emergencies Partnership have been putting digital mapping to work throughout the Covid-19 pandemic to help match human needs to local organisations
Throughout the Covid-19 pandemic, the British Red Cross has been working with the Voluntary and Community Sector Emergencies Partnership (VCSEP) and its network of over 250 organisations.
In doing so it has been drawing on digital mapping expertise partly developed in emergencies in other countries, using mapping software provided by Esri.
Adam Rowlands, director of digital at the British Red Cross, says the organisation is “proud of its role providing GIS [geographic information system] and information management expertise globally to help those in crisis”, adding that “it is one of the most requested skills following emergencies”.
The British Red Cross is a founding member of the VCSEP, which was created following the Grenfell disaster and the London and Manchester terrorist attacks in 2017 to improve coordination between voluntary sector organisations. VCSEP partners include St John Ambulance, The Salvation Army and more than 200 local organisations.
Rowlands says the British Red Cross “focuses on partnerships, and open data and digital systems are a key component of this, while the VCSEP builds on the British Red Cross’s experience supporting initiatives such as Missing Maps and Humanitarian Data Exchange”.
Mapping the pandemic response
The organisations have been putting interactive digital maps to use during the pandemic crisis in the UK, with what they describe as a goal of promoting multi-agency working and increasing the efficiency of the overall response.
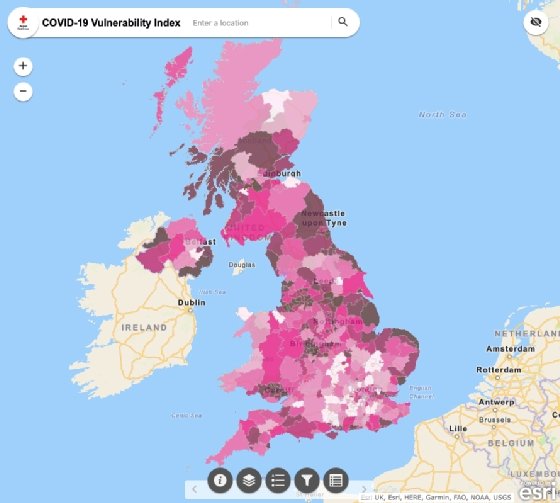
The maps are a VCSEP Covid-19 Response Map and a British Red Cross Covid-19 Vulnerability Index Map.
Alexei Schwab, senior information manager at VCSEP, says that by gathering intelligence on gaps and emerging needs, in relation to where the VCSEP partners are, Esri mapping helps coordinate an efficient response and avoids any duplication of effort.

“Insights can be easily shared with members to help develop the best allocation of resources, with a focus on people who are the most vulnerable,” he adds. “Previously, local knowledge and relationships were heavily relied upon, but now we have the spatial data to spot geographic trends and make more informed decisions to supplement vital local knowledge.”
In an interview with Computer Weekly, Schwab says that when Covid hit, the VCSEP was scaled up, the network was expanded and became more active, with a more formal structure and management.
Describing the network effect of the VCSEP in operation, he says: “The British Red Cross can share something out to the network, and [a partner organisation] will say, ‘Well, that doesn’t quite look the same from where we are in this area’. And it can work the other way as well, in that smaller, more in-depth local organisations can feed into the network and raise issues that aren’t yet on the radar for the larger nationals.”
The Red Cross’s Rowlands tells Computer Weekly the VCSEP would not have worked had it been just one organisation’s initiative. “This was all about people coming together. We are most relevant when we are, say, helping a local council improve resilience.”
Prior to joining the Red Cross, Rowlands spent seven years working for Accenture on projects in east Africa, Latin America and Southeast Asia, for non-governmental organisations (NGOs) and governments. He describes how the organisation, which is part of the global humanitarian network of the Red Cross and the Red Crescent, is “90% domestic, which a lot of people miss”. The organisation also puts a big emphasis on data and digital collaboration, he says.
“I can give examples of really ambitious big data partnerships we’re part of globally, which positioned us, when Covid hit, to take some of those international learnings and embed them within the British context,” adds Rowlands.

“We do a lot of work overseas, supporting our sister societies, and one thing that is really key for us is that if you arrive in a disaster, you need accurate data. You need to know where people live, where the major issue is and the logistics of how to get there. Accurate data is one of the core risk core components of any crisis response,” he says.
“That data is only as good as everyone being able to contribute and help, so it’s no good if the British Red Cross knows that a road is closed but Médecins Sans Frontières thinks it is still open and send loads of cold-chain vaccines down that blocked road. This is really fundamental to what we do,” says Rowlands.
“With international responses, there’s something called the ‘cluster model’, whereby different organisations land in a disaster zone and they all take responsibility for different things. So, one will say ‘we’ll look after children’, one will say ‘we'll look after nutrition’, one will say ‘we'll take care of logistics’. The British Red Cross specialises in three areas: logistics; water and sanitation; and information management and cash. You’ve lost everything, how do we get you cash in an emergency?
“That information management piece is one that sometimes people see as the least sexy, because it’s just data, but it underpins everything we do.”

“Information management is an area that people see as the least sexy, because it’s just data, but it underpins everything we do”
Adam Rowlands, British Red Cross
To that end, he says, the British Red Cross supports geographic open source initiatives Missing Maps, which maps areas where people live at risk of disasters and crises, by contributing to OpenStreetMap, and MapSwipe, which aims to provide better maps for NGOs by capturing information on the ground on an app.
It also supports the Humanitarian Data Exchange, which collates nearly 20,000 humanitarian datasets from over 250 locations, drawn from 1,427 sources.
In the UK, says Rowlands, it has been using methodologies and skills developed overseas, including for the VCSEP, but is also able to use other, more settled technologies.
“Tools we use when we arrive in the DRC or Mozambique or the Bahamas following cyclones come from a range, like the Vulnerability Index, which is a very robust tool. But then sometimes we’re doing rough and ready analysis in an Excel spreadsheet, because that’s all the local country office can absorb.
“If we’re in a country in the global south, we might be relying on open data sources only or primary data. Whereas here, you have an ecosystem whereby the moment you’ve agreed to share data with St. John [Ambulance], there is a much richer pool of data, they can afford more expensive tools and analysis, they’ve got higher capabilities in-house. It’s a different level of maturity,” he says.
Moving mapping to the cloud
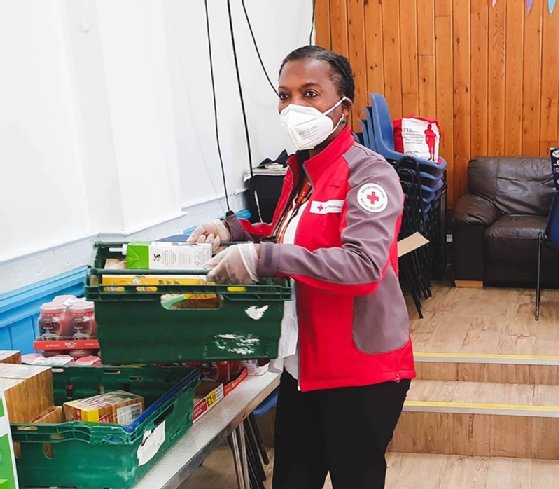
In the UK during the pandemic, Red Cross volunteers have carried out Covid-19 tests at care homes across Lancashire, delivered 800kg of food to a foodbank in Leominster following a 487% increase in demand, and supplied laptops to children to enable them to take part in online classes at home.

The British Red Cross has been using Esri’s GIS software for a long time, but only on the desktop. The coronavirus pandemic sped up the need to move GIS to the cloud, by way of a new Esri UK enterprise-wide licence, enabling more open sharing of geospatial data, the development of online maps and the integration of GIS with other Red Cross business applications, such as Microsoft’s Power BI.
“We have interesting Esri examples internally,” says Rowlands. “A recent example was for our crisis response team in Manchester. When something kicks off, they were previously going through multiple spreadsheets to see what cars we had, what equipment we had, who was on call at a certain time. We turned that into a web map so that that phone operator could say, ‘OK, you’ve called from here, the nearest vehicle is there, this is the person who’s on rota and here’s their mobile number’.”
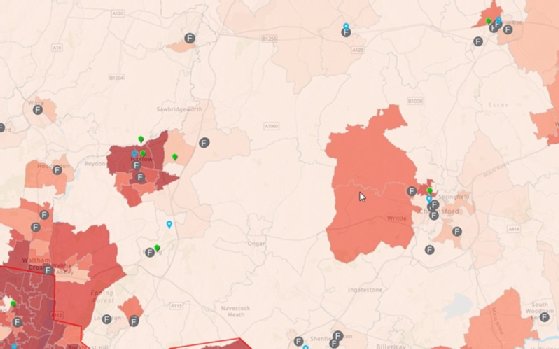
Central to the VCSEP Covid-19 response strategy is an interactive web map and a request for support service. These new tools help the British Red Cross and the VCSEP to understand and match which national and local voluntary organisations are best suited to meet requests from voluntary sector organisations for support, including testing, vaccinations, food, clothing and PPE.

“There is a huge appetite within the VCSEP to find new ways of visualising and working with data to support a joined-up emergency response. We are a small organisation with a large network, and better use of data can help drive further efficiencies”
Alexei Schwab,Voluntary and Community Sector Emergencies Partnership
The online Covid-19 Vulnerability Index map has been created using Esri technology, giving users a picture of which population groups are affected most by Covid-19, because of the virus itself, lockdown or furlough. Developed by the Red Cross, the map visualises multiple datasets, including clinical vulnerability, economic and financial vulnerability, social and other socio-economic data.
Future plans for GIS at the VCSEP include the pooling and sharing of more data, described as presently siloed within member organisations. Schwab says this is just the beginning. “There is a huge appetite within the VCSEP to find new ways of visualising and working with data to support a joined-up emergency response. We are a small organisation with a large network, and better use of data can help drive further efficiencies,” he adds.
“Covid was the catalyst for the scale-up,” he tells Computer Weekly. “Now that things are stabilising and improving with Covid, we’re looking ahead slightly longer term to how to carry that over into preparedness for the next event, the next crisis, so that the voluntary sector is plugged into that.”
Read more about digital technologies in emergency response
IT to the rescue: Mobile technology, digital mapping and geographical information systems all played a part in ensuring public safety during floods in the UK.
- The Syrian refugee crisis has engulfed the Middle East, but technology is proving to be an essential tool to help aid organisations support displaced people.
- Amazon Web Services offers up to $5,000 worth of credits to Australian local government, education and small and medium community organisations in disaster recovery programme.


