Mobile device trade-ins return to rise in value in Q3
HYLA Mobile study reports strong trade-in values amid the Covid-19 pandemic – with the value of devices at trade-in maintaining an upward trend in the third quarter

After a volatile half-year marked by stay-at-home orders and lockdowns, mobile device trade-ins are back on the rise, with $569m returned to US consumers thanks to a mobile device trade-in programme, according to the quarterly study from HYLA Mobile.
In its Q3 2020 trade-in trends insights, HYLA noted that this trade-in value represented an increase of 153% on the $225m returned in the second quarter. Its data revealed that one of the drivers for this rise was the average trade-in value for smartphones continuing to rise.
In Q2, HYLA reported strong trade-in values amid the Covid-19 pandemic – and the value of devices at trade-in has maintained that upward trend in Q3. The average trade-in value for a smartphone in Q3 was $121.03, a 9% increase from Q2 and a 22% rise year-on-year compared with Q3 2019.
“In Q2 we revealed the impact the global pandemic had on the secondary device market, and we are pleased to see that our latest data demonstrates that the market is recovering,” said HYLA president and CEO Biju Nair. “Trade-in values have steadily grown over the last six months and the money returned to US consumers more than doubled in the last quarter. This all points to a strong secondary market.
“The rise in value of both smartphones and wearables shows there is a demand for pre-owned devices, and savvy operators, retailers and OEMs are promoting trade-ins as a way to sell more new handsets to recoup lost revenues due to the pandemic – not only a win for them, but for consumers too.”
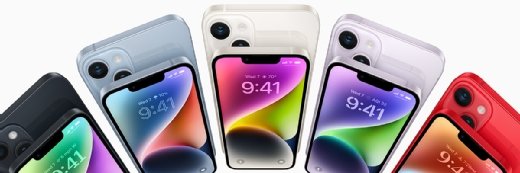
The study found that the five most-traded devices in the third quarter were all iPhones. The iPhone 7 was the top-traded device during the quarter, followed by the iPhone 8, iPhone 8 Plus, iPhone 7 Plus, and iPhone X. For the seventh quarter running, the iPhone 7 was the top-traded Apple device.
The analysis noted that the third quarter of the year traditionally sees a spike in trade-ins due to the release of new iPhones, but with Apple’s launch event delayed to October, it said the rise in trade-ins in the quarter could not be attributed solely to that.
The Samsung Galaxy S9 replaced the Samsung Galaxy S7 as the most-traded Android device in Q3. The Galaxy S7 had reigned as top-traded Android device for nine consecutive quarters, from Q1 2018 to Q2 2020.
Read more about mobile devices
- There is little demand for new devices and 5G technology, as enterprises focus on saving cash rather than upgrading corporate smartphones, says Gartner.
- Cheaper and more available smartphones set to drive 5G adoption surge with arrival of 5G-enabled iPhones, particularly in Europe and North America, along with momentum in China, to push worldwide 5G connections to 3.6 billion by 2025.
- Factors like cost, usage, applications, management, longevity and security figure highly in the selection of company-issued smartphones, laptops and printers for digital workers.
The average age of a smartphone at trade-in was 3.21 years, up from 3.13 years in Q2. The average age of an Android device was 2.84 years, while the average age of an iPhone at trade-in was 3.39 years. Online device trade-ins rose by 4.5% compared with Q2 2020 and by 170% on the equivalent quarter a year ago.
The study also found that smartphones were not the only device to show an increase in trade-in value in the third quarter. The average value of an Apple Watch at trade-in was $93.34, compared with $83.61 in Q2, a rise of 12%. The average Q3 value of an Apple Watch Series 5 at trade-in was $207.11 in September, up 8% from the last month of the previous quarter. The average trade-in value of each series of Apple Watch rose throughout the third quarter of 2020, ending with a higher value than at the beginning of Q2.
Looking ahead to Q4 and the emergence of 5G phones, including the iPhone 12, onto the smartphone market, Biju said: “Trade-ins were the only ancillary service mentioned at the Apple event and, with that being said, we are excited to see the impact from the launch of the iPhone 12 on next quarter’s data.
“Whether consumers prefer Android or Apple devices, they have plenty of choice in 5G phones. With an upgrade super cycle on the horizon, we are expecting trade-ins to boom over the next three months and beyond.”