Microsoft SQL Server data profiling tool put to work
Andy Hogg demonstrates how to clean up dirty data with the data profiling tool that comes with Microsoft SQL Server
In this second delve into data cleanliness (read the first, How clean is your data?, here), we’ll test-drive the data profiling tool provided with Microsoft SQL Server.
Other profiling tools have richer features (which you’ll pay for); but a SQL Server licence allows you to use this modest profiling tool at no extra cost.
Let’s explore the tool by profiling some data in the AdventureWorksLT database.
You’ll need Integration Services installed, along with the cut-down version of Visual Studio bundled with SQL Server. In SQL Server 2012, that’s "SQL Server Data Tools"; in SQL Server 2008, it's “Business Intelligence Development Studio”.
If you’re missing these components, simply run the SQL Server setup program and tick the relevant boxes.
Configuring the profiling tool
Start whichever Visual Studio environment you have, and create a new Integration Services project. Next, from the SSIS Toolbox, drag a Data Profiling Task onto the design surface and double-click on it to configure.
Profiling results are stored as an XML file, so specify the name and location of the file.
Click in the blank box next to Destination, and an arrow will appear.
Click on the arrow and then on <New File connection..>.
In the resulting box, specify a path and filename (including .xml suffix).
Click OK then click the Quick Profile button.
Click the New button next to ADO.NET Connection.
In the box that appears, specify the SQL Server and database hosting the data to be profiled (I’m using the AdventureWorksLT2012 database) then click OK.
Use the Table or View drop-down box to choose the data to be profiled (I’m using SalesLT.Product).
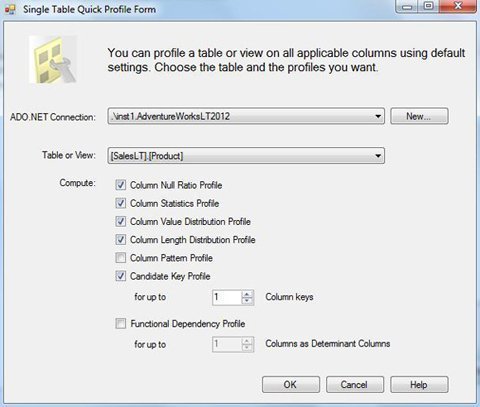
Accept the ticked defaults, and click OK, and OK again to go back to the design surface.
Finally, find yourself a trumpet, play a little fanfare, and press the F5 key to start profiling.
The profiling should complete successfully – indicated by a green box in SQL Server 2008, or a green tick in SQL Server 2012. If you see a red box or a red cross, then the Progress tab can help identify what went wrong.
Viewing the results
Assuming you see green (everyone’s happy colour in Integration Services), then start the “Data Profile Viewer” application. On the start menu, this is in the “Integration Services” sub-folder, within the “Microsoft SQL Server XXXX” folder.
In the viewer, click the Open button and locate the xml file you configured previously. You can now see the results of the profiling.
The Adventureworks data is squeaky clean, so I’ve made some modifications to mine that you won’t see when profiling yours.
In the left pane of the viewer, you can see the table we chose, and underneath it a list of the five different ways the data has been profiled (the five boxes ticked by default when we configured the task).
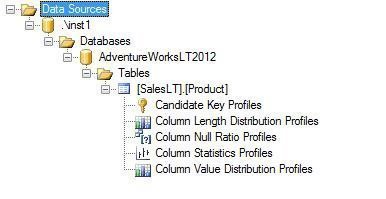
Click on Candidate Key Profiles and in the pane on the right, the results of that profile are displayed.
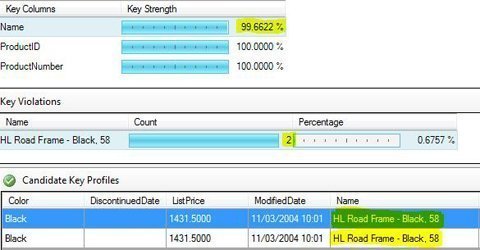
This profile shows uniqueness of values, and looking at my (doctored) data, the Name column contains values less than 100% unique.
I can investigate further by clicking on Name which then shows further information in a Key Violations section underneath.
The errant product is “HL Road Frame – Black, 58”, and the problem is that there are two rows with the same name (product names are usually unique).
By clicking on the problem product in Key Violations, the rows needing attention are displayed.
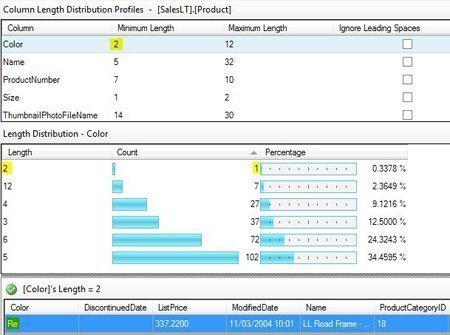
In the left pane, click on Column Length Distribution Profiles.
As the name implies, this profiles the length of the values in each column.
In my results, the Color column contains a value with a minimum length of 2.
By drilling down as we did in the previous example, I can see the distribution of those values, and by drilling down further I see the actual row with the dirty data.
The remaining profiles operate similarly.
Column NULL Ratio Profiles shows the percentage of NULL values in a column.
Useful when you have columns that really shouldn’t contain NULLs, e.g. “Product Name”.
Column Statistics Profiles displays the minimum, maximum, average, and standard deviation of date and number values. Handy for spotting 327-year-old employees, and products with a negative price.
Column Value Distribution Profiles identifies how many different values are present in a column. Helpful when you have a column like “Gender”, where you expect just a couple of different values, but find 15.
Two more profiles are available which are not enabled by default.
One of these, Functional Dependency Profile can identify problems with columns whose value is dependent upon the value of another column.
This is great for checking addresses; for example we would expect addresses sharing the same postal code to always be in the same city.
And finally
A limitation of the profiling tool is that source data must be stored within a SQL Server database. If you wish to profile data stored in flat files, for example, then you must first load that data into a SQL Server database.
Additionally, it’s not possible to extend the tool by creating additional custom profiles – the functionality you see is very much what you get.
Limitations aside, this tool provided with SQL Server is an excellent starting point for anyone wanting to get up and running quickly with data profiling.

Andy Hogg is a freelance consultant specialising in Microsoft SQL Server and associated technologies.