How to gather BI dashboard user requirements to nail business strategy alignment
Many analytical systems -- data warehouses, business intelligence systems -- fail because user requirements are not collected properly

Failure is such an ugly word. Sadly, many analytical systems – data warehouses, business intelligence (BI) dashboards and systems – do fail. It is clear that one major reason for failure is that user requirements are not collected properly, or perhaps not at all in the worst cases.
A project that starts from the assumption that the people who are to build the system know (in some magical, instinctive way) what the users will want from it is a train crash in the making.
The users of the data – those who will perform the analyses the system is intended to facilitate – must be included in the overall design process, and from an early stage.
So it is vitally important to collect user requirements and to ensure that these are aligned with the overall strategy of the business.
One reason given for failing to collect user requirements is that it is too hard; which is a bit like Bentley saying “We didn’t put an engine in our new model because they are really hard to manufacture”.
It is also not true. User requirements certainly take time, effort, dedication and tact to collect formally, but the process is relatively simple, in principle.
It is vitally important to collect user requirements for analytical systems and ensure these are aligned with the overall business strategy
Identifying analytical requirements
The first step is to identify those groups of people who have similar analytical requirements – these are often people within the same department.
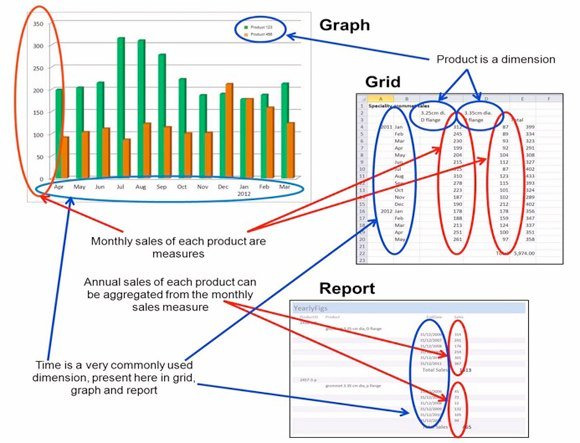
As a group, ask them to describe what would appear on the screen if they were presented with the perfect dashboard. Most users will answer in terms of dials, traffic lights, graphs, grids of data (in other words, spreadsheets) and reports.
On the face of it, these dials and graphs are very different animals, but it turns out that they all display exactly the same two "types" of information – the difference is simply in the presentation.
The two important common features are measures and dimensions. Measures are the numerical values that people want to analyse, and dimensions are the way in which they want the measures to be sub-divided.
So, we can note all of the dials, graphs, etc, and create what is called a conceptual model, which simply shows the measures and dimensions. If we capture these accurately, we have a model of the analysis that the users wish to perform.
Conceptual models are typically graphical representations, often with associated explanations where specific clarification is needed. There are several different models from which you can choose.
User requirements within one department may yield several conceptual models. In a human resources department, for example, those involved with salaries are likely to perform different analyses from those involved in recruitment.
Tips
Start small – Work with one department or sub-section of a department on a ‘proof on concept’. Produce results quickly. It helps keep the engagement and enthusiasm levels up and is excellent PR when the project expands.
Communicate – Talk to users somewhere quiet, without interruptions, at a time properly scheduled into the diaries of everyone involved.
Keep users informed of progress – It is all too easy to undermine any rapport and enthusiasm generated during user requirement gathering if all the users hear for the next six weeks is a stony silence.
Happily this requirement collection process works equally well for existing must-have analytical outputs (the end-of-month reports the CXOs demand) and for blue-sky thinking (“it would be really useful to see x in terms of y and z – and we can’t do that at present”).
Once the conceptual models have been developed and agreed with the users, the models can be unified into a model of analysis that meets the business strategy.
After that, from the unified conceptual models it is possible to back-extrapolate to find what data is required to deliver the analyses. This data may have to be extracted from the source systems, transformed into a consistent state and loaded into a central repository, often a data warehouse. From here it is delivered into specific dimensional structures in data marts, and it is against the data in these marts that users perform the required analysis.
About the author
Mark Whitehorn works as a consultant for national and international companies, specialising in the areas of databases, data analysis, data modeling, data warehousing and business intelligence (BI). Professor Whitehorn also holds the chair of Analytics at the University of Dundee, where he works as an academic researcher, lecturer and runs a Masters programme in business intelligence.